BSS Dashboard
The BSS Dashboard has been introduced as a tool for providing a fast, accurate, effortless, and user-friendly overview of your business's performance with meaningful statistics such as metrics, KPIs, and other relative data. The tool's purpose is to reduce the business operational costs, eliminate the wrong assumptions of their revenue projections, minimize the risk of missing critical information, and assist in important business decisions/activities. Overall, this tool provides the user with a complete business productivity-improving dashboard while they retain their focus on managing more efficiently their business. When the user logs in the BSS platform with his credentials, the tool becomes available on the home page of BSS instead of the current calendar view.
Dashboard Currency
The dashboard's amounts and currency signs are being displayed based on the predefined organization's currency, found under the "Organization Profile". However, for each following widget, we may take different exchange rates into consideration. More specifically:
- For the "General Statistics" widget: We always take into account the current rate between these currencies, and ignore historic data of exchange rates for this widget. This applies to all metrics in this widget whose data stem from invoices.
- For the "Product Mix" widget: We take into account the exchange rate between these currencies for the invoice date of the specific invoice, so we first look into the historical data of the currency rate, then we look for whether there is a record of the exchange rate that includes the specific invoice date, and if there is, we make use of that exchange rate. If there are no historical data for this exchange rate for the specific invoice date, we take into account the current exchange rate.
Dashboard Widgets
Dashboard widgets are essentially the tools for graphically depicting the most vital information of all the statistics, metrics and KPIs from the BSS platform, in such a way that you can obtain fast all the information required for assisting you in your business management and activities.
A drop-down menu exists on the upper right corner of the BSS dashboard page, through which the BSS user has the capability to set the time range of all the charts where this is applicable (see "clock" ![]() icon) and view their current time range. The data of each widget will get updated accordingly.
icon) and view their current time range. The data of each widget will get updated accordingly.

By default the option "This Month" is selected on the time range. Upon clicking on the arrow next to the default choice, a drop-down menu shall open with the following fixed options for the time range:
- This Month (default): The current calendar month up to the current date.
- Last 3 Months: The past three consecutive months, meaning the current month plus the past two months.
- Last 6 Months: The past six consecutive months, meaning the current month plus the past five months.
- Last 12 Months: The past twelve consecutive months, meaning the current month plus the past eleven months.
General Statistics (of Organization) WIDGET
The General Statistics widget provides the BSS user with several statistics of their organization and consists of many metrics such as: Monthly Recurring Revenue, Monthly Revenue, New Resellers this month, Total Resellers, Total Customers. This widget is not time-dependent, since some of its metrics already refer to a specific time range, such as "This month" and some refer to the current state. Let us further analyze the following image:
Monthly Recurring Revenue
The first metric displayed is the "Monthly Recurring Revenue"(MRR), i.e. the costs that resulted from selling recurring products (i.e. products that create subscriptions) during the current month, up to the current date for all the accounts of the BSS user's organization. We consider the debit & credit invoices whose status is either "Paid" or "UnPaid" and only the invoice items that create recurring subscriptions. More specifically, we will consider the final price of each invoice item and multiply it with its quantity. We do not consider taxes, cancelled invoices, proforma or pending invoices at all. If the resulting amount is negative, it is displayed with its negative value.
Metric's Availability: The Monthly Recurring Revenue metric may not be visible if the BSS user has disabled the "Invoices" section on their settings.
Monthly Revenue
The second metric displayed is the "Monthly Revenue"(MR), i.e. the costs that resulted from selling products during the current month, up to the current date. We consider the "total before tax" amount (as seen on BSS) displayed on the debit & credit invoices, whose status is either "Paid" or "UnPaid". We do not consider taxes, cancelled invoices, proforma or pending invoices at all. For the calculation of monthly revenue, we sum the "total before tax" amounts found on the debit invoices and we deduct the sum of all the "total before tax" amounts found on the credit invoices. If the resulting amount is negative, it is displayed with its negative value.
Metric's Availability: The Monthly Revenue metric may not be visible if the BSS user has disabled the "Invoices" section on their settings.
New Resellers this month
The third metric displayed is the "New Resellers this month". The amount depicted is the result of the summation of all the accounts that have their creation date in the current month, up to the current date and have the flag "reseller" checked at the current time. If a lite reseller's account is converted into a tenant reseller account, during the current month and up to the current date, shall also be depicted in this metric.
Metric's Availability: The New Resellers this month metric may not be visible if the BSS user has disabled the "Accounts" section on their settings.
Total Resellers
The fourth metric displayed is the "Total Resellers". The amount depicted is the result of the summation of all the accounts that have the flag "reseller" checked at the current time. A tenant reseller that used to be a lite reseller shall be depicted also in this metric.
Metric's Availability: The Total Resellers metric may not be visible if the BSS user has disabled the "Accounts" section on their settings.
Total Customers
The fifth metric displayed is the "Total Customers". The amount depicted is the result of the summation of all the accounts of your direct customers and the end-customers of your reseller.
Metric's Availability:
- The Total Customers metric may not be visible if the BSS user has disabled the "Accounts" section on their settings.
- Different BSS platform editions see different versions of the BSS dashboard. More specifically, the metrics: "New Resellers this Month" and "Total Resellers" are hidden for BSS organizations if your interworks.cloud edition does not support resellers' management. The platform edition of a BSS organization can be found under: BSS Setup > System Options > Organization Profile section.
Product Mix WIDGET
The Product Mix widget displays by default all the Products that the BSS user (distributor or tenant reseller) has sold in the time range set as slices of a pie-chart, filtered by Product Types and Charge Type, and the percentage of each slice is compared to the percentage of the total sales. Each slice of the pie-chart has a distinct color, which correlates to the legend that is located below the chart, and it is where the mapping of the sliced data occurs. This widget is time-dependent as indicated by the clock icon, located on the upper right corner, and is entirely related to the central time range set.
The information for this chart is retrieved from all the debit invoices existing in the current BSS organization, with invoice dates in the specified time range and status "paid"/"unpaid". The tool does not consider canceled or pending invoices for its calculations. It sums the amounts it retrieves for these invoice items on the respective debit invoices, for a given period, and then sums them with the total amount calculated for each product. Concerning the resulted cost from the Azure Usage invoices, we collect the "Final Price" as shown on BSS and this is the value depicted on the product mix.
The BSS user has the option to filter the data' visual representation of the Product Mix pie-chart by utilizing the two drop-down menus located on the upper left corner of the widget:
- Product Type: From the first filtering drop-down menu on the upper left corner of the Product Mix widget, the BSS user is able to set the Product Type of the chart and thus change the view of the pie-chart. Other than the "All" filtering option which is the default one, as it depicts everything, more options exist for filtering the Product Mix chart concerning specified Products belonging to certain Product Types:
Product Type: Once selected, the product mix chart gets redrawn with the corresponding contribution data which consists of Products belonging to the chosen Product Type, during the time range set. As a result, different choices of product types will result in a pie-chart with different products along with their corresponding chart percentage.
- Charge Type: From the second filtering drop-down menu on the upper left corner of the Product Mix widget, the BSS user is able to set the Charge Type of the chart and thus change the view of the pie-chart. Other than the "All" filtering option which is the default one, as it depicts everything, there exist two more options of filtering the Product Mix chart concerning the charge type:
- Subscriptions: Once selected, the product mix chart gets redrawn with only the percentages of subscription-based product types/products, regardless of their billing cycle. Such products can be recurring products or products with usage charges.
- One time charges: Once selected, the product mix chart gets redrawn with only the percentages of Non-subscription based product types/products. Such products can be assets and one-off products, created as such on our BSS platform.
Upon hovering over a slice of the pie chart, the BSS user is able to view the respective Product Type/Product, along with its percentage contribution and the non-taxed actual invoiced amount, for the specific time range in comparison to the total. The currency displayed is based on the organization's default currency.
Widget's Availability: The Product Mix widget may not be visible if the BSS user has disabled the whole "Billing" section or the "Invoices" section on their settings.
When the "Invoices" section is checked but the "Products" section is unchecked on settings, the BSS user is still able to see the product mix with the products it comprises of, since the invoices containing the products are available to them.
Subscriptions Churn WIDGET
The Subscriptions Churn widget displays a double bar-chart of the new and canceled subscriptions(not Assets) for all or specific Vendors that the BSS user (distributor or tenant reseller) has sold in the time range set. The bar-chart consists of two axes, the horizontal being the time range(daily or monthly depending on the choice of options) and the vertical being the absolute number of subscriptions. For each unit of time depicted, two bars are displayed next to each other, representing the new subscriptions in blue color and the canceled subscriptions in orange color. The numbers displayed on the vertical axis shall be adjusted based on the min/max values of the minimum and maximum values of the new and cancelled subscriptions for the time range selected via the central time range drop-down menu, since this widget is time-dependent as indicated by the clock icon, located on the upper right corner. More specifically, when the BSS user has selected to view the central time range for "This Month", the chart will become daily, therefore the horizontal axis will display all the days, whereas if the BSS user has selected either "Last 3 Months" or "Last 6 Months" or "Last 12 Months", the chart will become monthly, therefore the horizontal axis will display all the months included in the time range selected. Once the BSS user selects a Vendor, he is able to view the new and cancelled subscriptions only of the specific Vendor across the time range set. Upon hovering over a bar, the absolute number of the bar is displayed. 
The trial subscriptions, as well as the subscriptions that resulted from renewals of older ones, will not be counted in this metric. As cancelled subscriptions, we consider the absolute number of those whose status was set to "Canceled" in that specific unit of time (either day or month, depending on the time range set). These calculations happen on the spot, so that the BSS user can view the current state. We do not consider the subscription quantity for these metrics, only the absolute number of new and cancelled subscriptions.
The BSS user has the option to filter the data' visual representation of the Subscriptions Churn bar-chart by utilizing the drop-down menu located on the upper left corner of the widget, regardless of whether they belong to a specific Vendor or not:
- Vendors: From the first filtering drop-down menu on the upper left corner of the Subscription Churn widget, the BSS user is able to set the Vendors that stem from the new/canceled subscriptions with created/cancellation date in this time range, titled after the respective Vendor names, as they appear on our BSS.
- This drop-down menu will have a value for each auto-provisioned service, such as: "Panda", "GSuite", "Acronis" and "Kaspersky".
For the non-provisioned services, the drop-down menu has a general value named "Other subscriptions" which contains all the subscriptions from product types that are manually created inside the BSS.
Widget Availability: The Subscriptions Churn widget may not be visible if the BSS user has disabled the whole "Billing" section or the "Subscriptions" section on their settings.
Expiring Subscriptions WIDGET
The Expiring Subscriptions widget provides the BSS user with a view of the top fifty (50) active subscriptions (along with their respective data) with annual or lengthier billing cycles, that are expiring in thirty (30) or fewer days, regardless of whether they are automatically renewed or not. This widget is not time-dependent, since its metrics already refer to a specific time range. Let us further analyze the following image:

By examining the columns that reside within the table as well as the data that each one retains, the BSS user can witness the following:
Subscription: The friendly name of a subscription is displayed (if given), otherwise, the default name of the subscription appears. This is a redirection link that leads the BSS user directly to the page of the subscription with this ID.
Account Name: Is either the reseller's or the end-customer's account name.
Progress: Is the percentage of the usage progress of the subscription, meaning the result of the calculation between the subscription's remaining days divided by the subscription's total days. The colored text that is being displayed for each progress, better visualizes the overall progress level and significance of possible future actions. For example:
From 0% to 50% progress, the color is green (low significance).
From 51% to 75% progress, the color is yellow (medium significance).
From 76% to 100% progress, the color is red (high significance).
Expiring in (Default sort): Is the number of days a subscription is expiring in. The "Expiring Subscriptions" table is sorted based on this column since the most important element of the table is the subscriptions that are closest to being expired.
Quantity: Is the quantity of a specific expiring subscription.
Subscription Amount: Is the subscription amount displayed on a subscription's page-view, and it is always displayed without taxes.
Widget Availability: The Expiring Subscriptions widget may not be visible if the BSS user has disabled the whole "Billing" section or the "Subscriptions" section on their settings.
Expiring Assets WIDGET
The Expiring Assets widget provides the BSS user with a view of the top fifty (50) active assets and one-off products which have an expiration date (along with their respective data), and are expiring in thirty (30) or fewer days. Such assets can be, for example, Microsoft's Azure Reserved Instances. On the contrary, assets deriving from Microsoft ESD for example, do not have an expiration date and are therefore not displayed on this table. This widget is not time-dependent, since its metrics already refer to a specific time range. Let us further analyze the following image:

By examining the columns that reside within the table as well as the data that each one retains, the BSS user can witness the following:
Assets: Is the default name of an asset. This is a redirection link that leads the BSS user directly to the page of the asset with this name and characteristics.
Account Name: Is either the reseller's or the end-customer's account name.
Progress: Is the percentage of the usage progress of the asset, meaning the result of the calculation between the asset's remaining days divided by the asset's total days. The colored text that is being displayed for each progress, better visualizes the overall progress level and significance of possible future actions. For example:
From 0% to 50% progress, the color is green (low significance).
From 51% to 75% progress, the color is yellow (medium significance).
From 76% to 100% progress, the color is red (high significance).
Expiring in (Default sort): Is the number of days an asset is expiring in. The "Expiring Assets" table is sorted based on this column since the most important element of the table is the assets that are closest to being expired.
Quantity: Is the quantity of a specific expiring asset.
Asset Total Amount: Is the total amount of money this asset was sold for, and it is always displayed without taxes.
Widget Availability: The Expiring Assets widget may not be visible if the BSS user has disabled the whole "Billing" section or the "Assets" section on their settings.
Expiring Trial Subscriptions WIDGET
The Expiring Trial Subscriptions widget provides the BSS user with a view of the top fifty (50) active trial subscriptions (along with their respective data), that are expiring in five (5) or fewer days. This widget is not time-dependent, since its metrics already refer to a specific time range. Let us further analyze the following image:

By examining the columns that reside within the table as well as the data that each one retains, the BSS user can witness the following:
Trial Subscription: The friendly name of a trial subscription is displayed (if given), otherwise, the default name of the trial subscription appears. This is a redirection link that leads the BSS user directly to the page of the trial subscription with this ID.
Account Name: Is either the reseller's or the end-customer's account name.
Progress: Is the percentage of the usage progress of the trial subscription, meaning the result of the calculation between the trial subscription's remaining days divided by the trial subscription's total days. The colored text that is being displayed for each progress, better visualizes the overall progress level and significance of possible future actions. For example:
From 0% to 50% progress, the color is green (low significance).
From 51% to 75% progress, the color is yellow (medium significance).
From 76% to 100% progress, the color is red (high significance).
Expiring in (Default sort): Is the number of days a trial subscription is expiring in. The "Expiring Trial Subscriptions" table is sorted based on this column since the most important element of the table is the trial subscriptions that are closest to being expired.
- Upgrade to paid (action button): Next to each active trial subscription, there is a button named "Upgrade to paid" and upon clicking on it, the trial subscription can be upgraded to a paid one. More specifically, the BSS user gets redirected to the trial subscription's view-page, where the modal titled “Upgrade Trial to Paid“ is being displayed, and where the BSS user is able to define the unit and the quantity of the subscription, as well as edit the pricing information of the subscription, before upgrading the trial one. Once the trial subscription has been upgraded to paid, an order is automatically placed for this product and an invoice is generated with the cost of the product. The start date of the upgraded subscription is considered the day that the user converted the trial subscription to a paid one. Please keep in mind that all constrains regarding the creation of a subscription apply here as well.
Widget Availability: The Expiring Trial Subscriptions widget may not be visible if the BSS user has disabled the whole "Billing" section or the "Subscriptions" section on their settings.
Pending Subscription Cancellation Requests WIDGET
The Pending Subscription Cancellation Requests widget provides the BSS user with a view of the top fifty (50) active subscriptions and add-ons (along with their respective data), that have pending cancellation requests, regardless of their status at the current date. This widget is not time-dependent, since its metrics already refer to a specific time range. Let us further analyze the following image:

By examining the columns that reside within the table as well as the data that each one retains, the BSS user can witness the following:
Subscription: The friendly name of a subscription is displayed (if given), otherwise, the default name of the subscription appears. This is a redirection link that leads the BSS user directly to the page of the subscription with this ID or of the add-on.
Account Name: Is either the reseller's or the end-customer's account name.
Request: Is a combination of the name of the product or add-on that is to be cancelled (followed by the word “add-on” if it is an add-on) multiplied by the quantity that is to be cancelled. We display an entry on the pending subscription cancellations requests widget for every cancellation request there exists, regardless of whether the cancellation requests concern the same subscription or not.
Request Date: Is the date that the cancellation request was initiated, based on the BSS user’s date format. The "Pending Subscription Cancellation Requests" table will be sorted by this column and the subscriptions whose cancellation request was made last (closest to the current date), will be displayed first.
- View Request (action button): Next to each entry of the pending request cancellation table, there is a button named “View request“ and upon clicking on it, the BSS user gets redirected to the respective subscription’s view-page, where the cancellation request modal for this subscription/add-on is being displayed, and where the BSS user is able to either cancel the respective subscription/add-on or just view the request and not act upon it immediately.
Widget Availability: The Pending Subscription Cancellation Requests widget may not be visible if the BSS user has disabled the whole "Billing" section or the "Subscriptions" section on their settings.
Customer's Submitted Unexecuted Orders WIDGET
The Customer's Submitted Unexecuted Orders widget(previously known as "Unexecuted Orders" widget) provides the BSS user with a view of the top fifty (50) unexecuted orders that were submitted through the Storefront (along with their respective data), due to insufficient credit limit, regardless of their status at the current date. This widget is not time-dependent, since its metrics already refer to a specific time range. Let us further analyze the following image:

By examining the columns that reside within the table as well as the data that each one retains, the BSS user can witness the following:
Order Code: Is the BSS code of the submitted order. This is a redirection link that leads the BSS user directly to the page of the order with this ID.
Account Name: Is either the reseller's or the end-customer's account name.
- Order Date: Is the date that the order was submitted, based on the BSS user's date format. The "Unexecuted Orders" table will be sorted by this column and the orders whose submission was made last (closest to the current date), will be displayed first.
- Total: Is the order's total amount of money displayed on the order's view-page, and it is always displayed without taxes.
Widget Availability: The Customer's Submitted Unexecuted Orders widget may not be visible if the BSS user has disabled the whole "Sales" section or the "Orders" section on their settings.
Orders For Manual Management WIDGET
The Orders For Manual Management widget provides the BSS user with a view of the top fifty(50) new orders that were submitted through the Storefront and need to be manually managed. In this widget, you can witness the orders that were created in the Storefront by their creator (Storefront user), in the form of a table list. Each order contains at least one order item which is a non-automatic execution service that is not yet executed or delivered. This widget is not time-dependent, since its metrics already refer to a specific time range. Let us further analyze the following image:
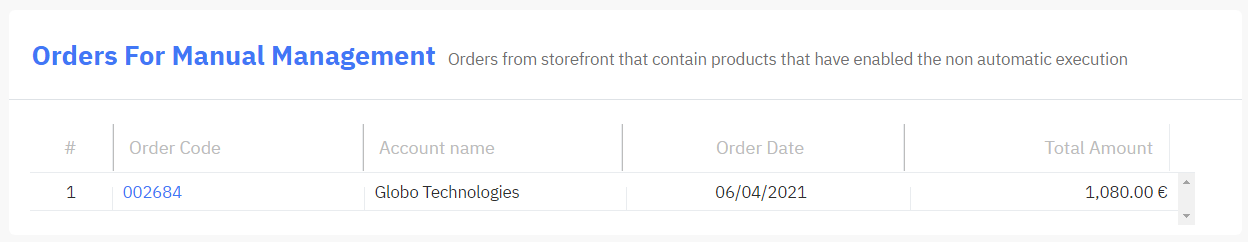
The columns of the table list are sorted by “Order Date“ and are the following:
Order Code: This is a link that redirects the user to the page of the order with this ID.
Account Name: This could be either the name of your reseller or the name of your direct customer.
Order Date: This is the date of the order, in the date format of the BSS user.
Total: This is the order amount displayed on the order view page, and is always displayed without taxes.
Widget Availability: The Unexecuted Orders widget may not be visible if the BSS user has disabled the whole "Sales" section or the "Orders" section on their settings.