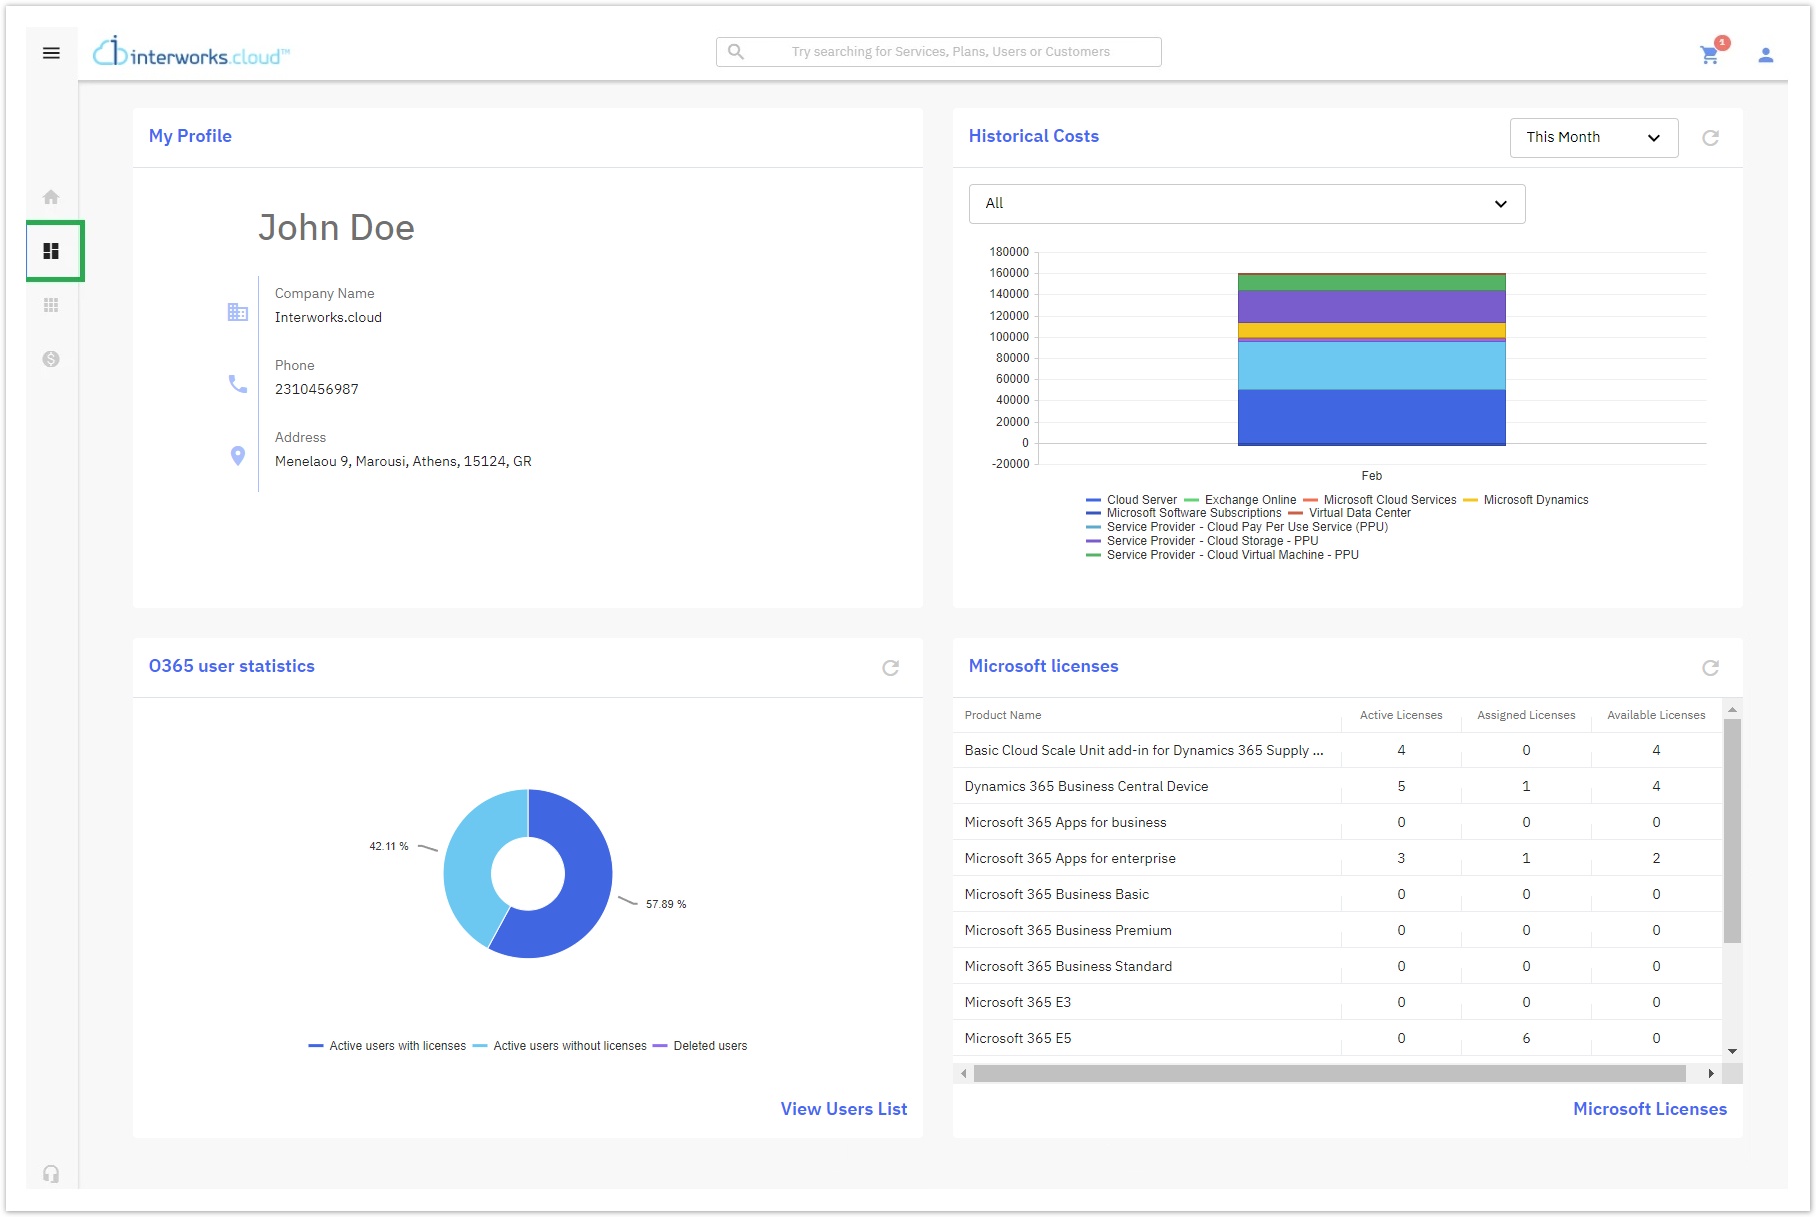
Direct Customer's Dashboard Widgets
The Direct Customer's Dashboard is introduced as a tool for providing a fast, accurate, effortless, and user-friendly overview of a direct customer's business performance with meaningful statistics such as metrics, KPIs, and other relative data. The tool's purpose is to eliminate wrong assumptions, minimize the risk of missing critical information, and assist in important business decisions/activities. Overall, this tool provides the direct customers with a complete business dashboard.
Accessing the Dashboard
When the direct customer logs into the Storefront with their credentials, the system will make available the tool only to them. In order to access it, the direct customer can click on the ![]() icon from the main menu of the Storefront, located on the left-hand side of the screen.
icon from the main menu of the Storefront, located on the left-hand side of the screen.
Dashboard Widgets
Dashboard widgets are essentially the tools for graphically depicting the most vital information of all the statistics, metrics, and KPIs from the BSS platform, in such a way that a direct customer can obtain fast all the information required for assisting him in his business management and activities.
Contact Details WIDGET
This Contact Details widget contains the contact details of the logged-in Storefront user.
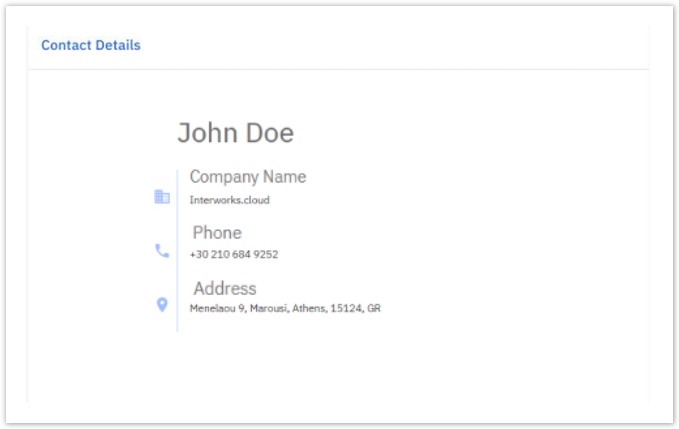
The following info will be displayed:
- Name: Is the first and Last Name of Storefront user as they are defined on the My Account page in Storefront. The name is now a clickable link that redirects the Storefront user to the My Account page.
- Contact Information:
- Company Name: as defined on the My Account page in Storefront.
- Phone: as defined on the My Account page in Storefront.
- Address: Address, City, Postal Code, and Country (in one line) as defined on the My Account page in Storefront.
In case any of the above information is missing from the My Account page, then the relevant information will be empty on the widget. The contact details in this widget are not editable but can be updated from the My Account Storefront page.
General Statistics (of Account) WIDGET
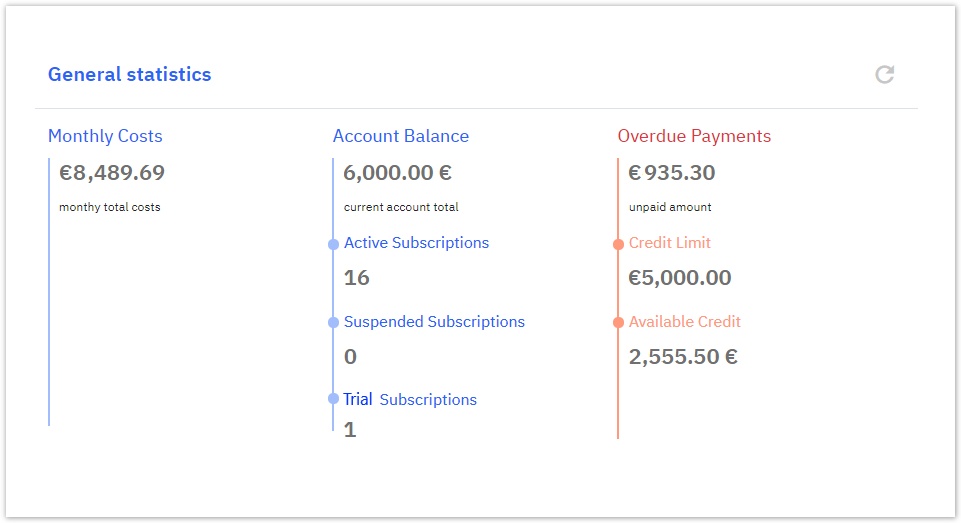
The General Statistics widget provides the direct customer with several statistics of their account by dividing the info into three columns having the respective color code, blue for the monthly costs and account balance columns, and red for the overdue payments column. Let us further analyze the following image:
Monthly Costs
The first metric displayed on the first column of the widget is the Monthly Costs, i.e. the costs that resulted from the direct customer's purchases during the current month, up to the current date. The displayed costs can be either positive or negative. The tool does not consider canceled invoices for its calculations. For the calculation of monthly total costs, the "total before tax" amounts found on the debit invoices are summed altogether and the "total before tax" amounts found on the credit invoices are also summed altogether. Therefore, "Monthly Costs" is equal to the "Debit Invoices" minus the "Credit Invoices".
Account Balance
The first metric displayed on the second column of the widget is the Account Balance. It is the amount(positive or negative) that stems from taking into account all the invoices, refunds, and payments billed to the direct customer since the creation of his BSS account. For more information concerning the Account Balance please proceed to the "Account Balance analysis" page.
Overdue Payments
The first metric displayed on the third column of the widget is the Overdue payments. It is the total amount of money that stems from the overdue invoices issued to the direct customer that have not been paid yet. This amount is calculated the same way as in the Account's BSS billing information.
Other Statistics
Several more statistics are contained within the three main columns which according to their column position are the:
- Active Subscriptions: Is the number of active subscriptions of the direct customer at the current date. All subscriptions with status "Active" & "Pending for cancellation" at the current date will be taken into consideration for this metric except for active Trial subscriptions, which are not considered for this metric. This metric is a link that redirects the user to the page containing all the "currently active" and "pending for cancellation" subscriptions on the "Billing" section of the Storefront under the "Subscriptions list" page shown with the filter "Active Subscriptions".
- Suspended Subscriptions: Is the number of suspended subscriptions of the direct customer at the current date. All subscriptions with status "Suspended" at the current date are taken into consideration for this metric. This metric is a link that redirects the user to the page containing all the currently suspended subscriptions on the billing section of Storefront under the Subscriptions list page shown with the filter "Suspended Subscriptions".
- Trial Subscriptions: Is the number of trial subscriptions of the direct customer at the current date. All trial subscriptions with status "Active" at the current date will be taken into consideration for this metric. This metric is a link that redirects the user to the page containing all the currently active trial subscriptions on the billing section of Storefront under the Subscriptions list page shown with the filter "Trial Subscriptions".
- Credit limit: Is the limit set on the credit of the BSS account of the direct customer, on the respective field on the "Ordering" information of the account. For more information on Credit Limit please continue in this "Setting Customer's Credit Limit" page. The "Credit Limit" is not visible for users whose BSS organization has Credit Check Hook enabled.
- Available credit: Is the total amount of money present at a specific time in the direct customer's BSS account, on the respective field on the "Ordering" information of the account. For more information on Available Credit please continue in this "Understanding how Customer's Available Credit is Calculated" page. The "Available Credit" is not visible for users whose BSS organization has Credit Check Hook enabled.
Historical Costs WIDGET
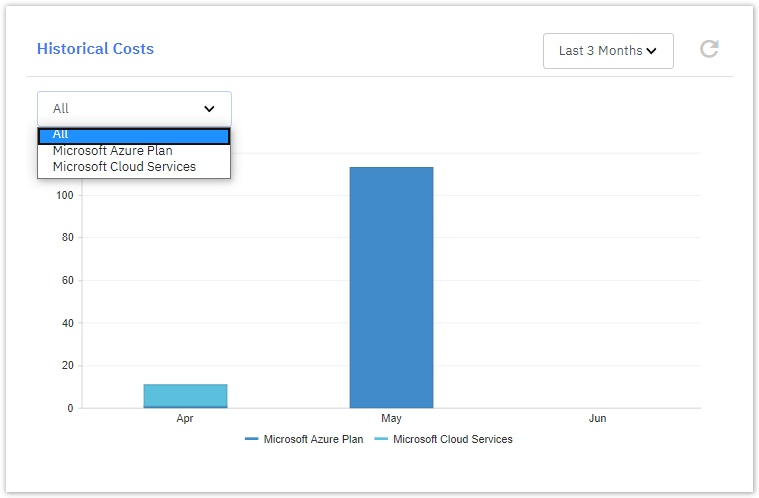
The Historical Costs widget displays a stacked bar chart of the monthly costs for all Products that the direct customer has purchased in the time range set and can be filtered by Product Types. The bar chart consists of two axes, the horizontal being the time range(months) and the vertical being the costs. For each month shown, a bar is displayed representing the costs over this month and each bar shall be divided into parts(stacks). Each stack of the bar-chart has a distinct color, which correlates to the legend that is located below the chart, and it is where the mapping of the sliced data occurs. The parts into which the bars shall be divided into results from the filtering that the direct customer selects. Moreover, a refresh button is placed on the top right corner of the widget for the Storefront users to be able to update the widget with the latest data.
For a specific month (bar) in the time range set, the costs of a direct customer for a specific product will result from all the debit and credit invoices, with invoice dates in that month with status paid/unpaid. The tool does not consider canceled invoices for its calculations. It sums the amounts it retrieves for these invoice items on the respective debit and credit invoices, for a given period, and then sums them with the total amount calculated for each product.
The direct customer has the option to filter the data' visual representation of the Historical Costs bar-chart by utilizing the two drop-down menus located on the upper left and right corners of the widget:
Product Type: From the first filtering drop-down menu on the upper left corner of the Historical Costs widget, the direct customer is able to set the Product Type of the chart and thus change the view of the bar chart. Other than the "All" filtering option which is the default one, as it depicts everything, more options exist for filtering the Historical Costs chart concerning specified Products belonging to certain Product Types:
- Product Type: Once selected, the historical costs chart gets redrawn with the corresponding contribution data which consists of Products belonging to the chosen Product Type, during the time range set. As a result, different choices of product types will result in a bar-chart with different products along with their corresponding chart percentage.
- Product Type: Once selected, the historical costs chart gets redrawn with the corresponding contribution data which consists of Products belonging to the chosen Product Type, during the time range set. As a result, different choices of product types will result in a bar-chart with different products along with their corresponding chart percentage.
- Time Range: From the filtering drop-down menu on the upper right corner of the Historical Costs widget, the direct customer is able to set the Time Range of the chart and thus change the view of the bar chart. The filtering options for the Historical Costs chart concerning the Time Range are:
- This Month (default): The historical costs chart by default depicts data from the current month.
- Last 3 Months: Once selected, the historical costs chart gets redrawn with data from the past three consecutive months, meaning the current month plus the past two months.
- Last 6 Months: Once selected, the historical costs chart gets redrawn with data from the past six consecutive months, meaning the current month plus the past five months.
- Last 12 Months: Once selected, the historical costs chart gets redrawn with data from the past twelve consecutive months, meaning the current month plus the past eleven months.
More specifically, when the direct customer has selected to view the chart for either "This Month" or "Last 3 Months" or "Last 6 Months" or "Last 12 Months", the horizontal axis of the chart will always display months, depending on the time range selected.
When "All" is selected from the Product Type drop-down menu, upon hovering over a stack of the bar-chart, the direct customer is able to view the respective Product type, along with its cost for the specific month.
Latest Orders WIDGET
The Latest Orders widget displays a list table of the fifteen most recent orders placed by the direct customer according to the order date. This widget allows the direct customer to have a quick view of his latest orders without the need to change the page in Storefront in order to have that information available. Also, a single button named View all orders redirects the direct customer to the Orders History page of the Storefront for viewing all the orders. The functionality of this widget is very similar to the Orders' list found inside the Billing page. Moreover, a refresh button is placed on the top right corner of the widget for the Storefront users to be able to update the widget with the latest data.
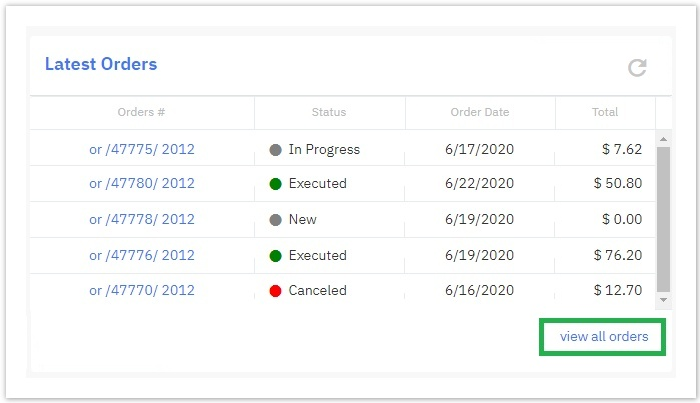
The columns shown in this widget's list are the following:
- Order ID: Is the retrieved identification number from the respective order. This is a link that redirects the direct customer to the page of the order with this ID.
- Status: Is the indicator of the status of an order.
- Order Date: Is the date of the order's execution.
- Total: Is the amount of money this order is worth, found on the respective order.
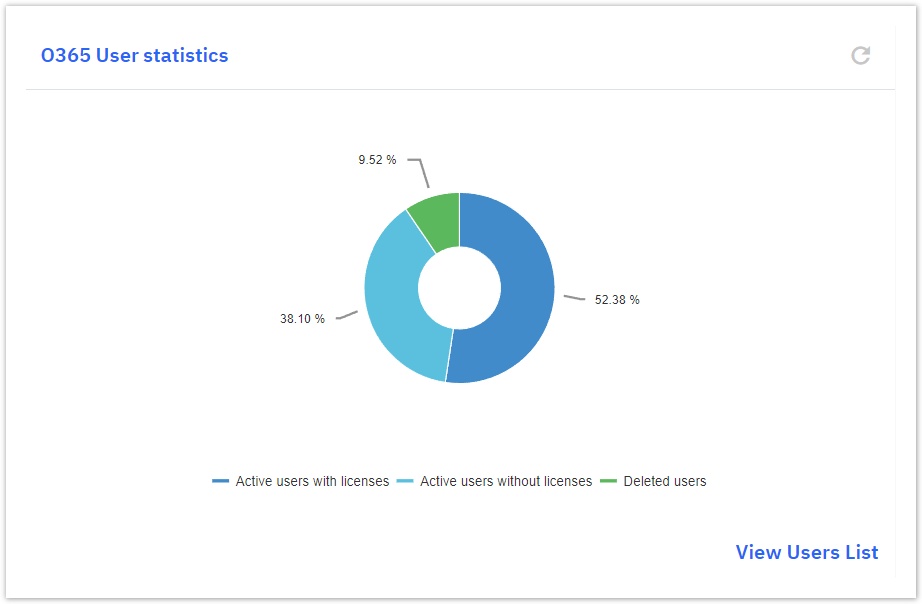
O365 User Statistics WIDGET
The Office 365 user statistics widget displays in a pie chart the percentage of Office 365 users who are inactive as well as the active users who either have licenses or do not. The data for the chart is derived from the Users List table displayed in User Management for Microsoft Office 365 in the direct customer’s Storefront. Each slice of the pie chart has a distinct color and is accompanied by its respective legend. Next to the respective colored slice, the percentage of the users is displayed. Furthermore, upon hovering over a slice, the actual number of the users, including the status, is being displayed. Moreover, a refresh button is placed on the top right corner of the widget for the Storefront users to be able to update the widget with the latest data. Also, a View Users List button is placed on the bottom right corner of the widget, which directs the user to the User Management for Microsoft Office 365 in their Storefront. The data is in sync with Microsoft Partner Center.
Microsoft Licenses WIDGET
The Microsoft Licenses widget displays a list table containing details for the Microsoft Office 365 and Dynamics licenses. The widget allows the direct customer to have a quick view of the active licenses, the assigned licenses, and the number of licenses that are still available, per Microsoft offering. Scrolling can be used in case it is necessary to view the Microsoft licenses. Also, a refresh icon is placed on the top right corner of the widget and every time it is clicked, the table will be updated with the latest data from Microsoft Partner Center. Furthermore, a Microsoft Licenses button is placed at the bottom right corner of the widget which redirects the direct customer to the User Management page of Microsoft Office 365 in Storefront.
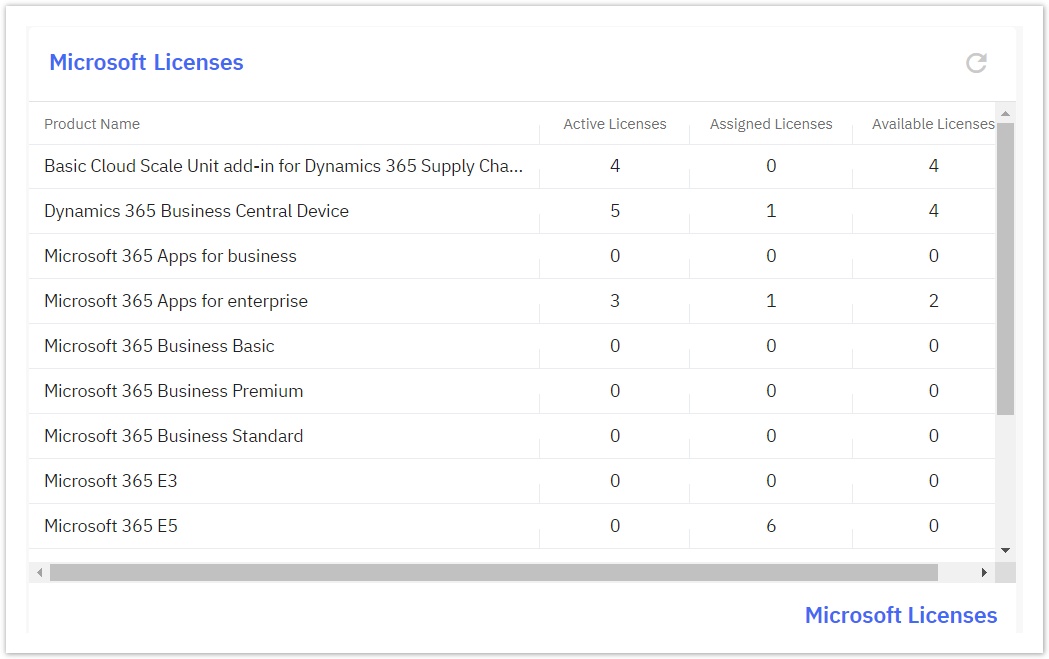
The data are displayed under the following four columns:
Product Name: This column is where the Microsoft product names are displayed.
Active Licences: This column is where the active licenses per product name are being displayed.
Assigned Licences: This column is where the assigned licenses per product name are being displayed.
Available Licences: This column is where the available licenses per product name are being displayed.
Expiring Assets WIDGET
The Expiring Assets widget displays a list table of the ten (10) most close-to-expiring assets with an expiring date of thirty (30) days or less. This widget allows the direct customer to have a quick view of the expiring assets and one-off products along with their respective data. Examples of such assets are the RIs and Software Subscriptions. However, assets such as the ones deriving from Microsoft ESD, do not have an expiration date currently and therefore are not displayed on this table at all. The main purpose of this widget is to prompt the direct customer into taking proactive actions towards those expiring assets. Moreover, a refresh button is placed on the top right corner of the widget for the Storefront users to be able to update the widget with the latest data.
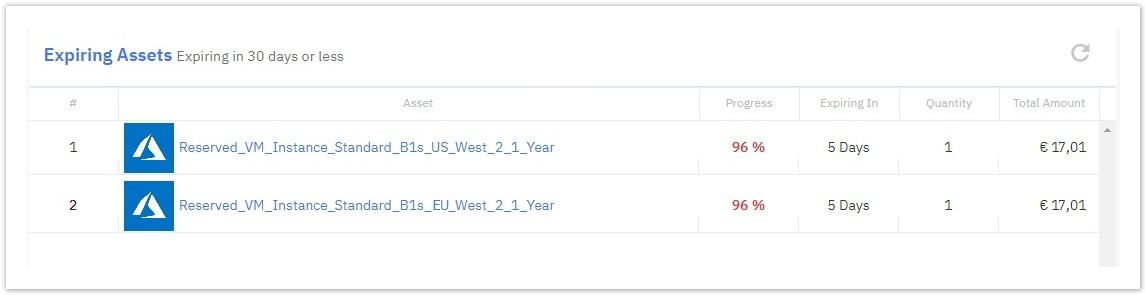
The columns shown in this widget's list are sorted based on the "Progress" column by the closest to being expired and are the following:
- Asset: Is the name of the asset; this is a link that redirects the direct customer to the page of the asset with this name & characteristics.
- Progress: Is the asset's expiration date against the current date, over the total duration of the asset, in the form of a percentage. Meaning that the closer the percentage reaches 100, the less are the remaining days of that asset, before it expires. For example, two assets expire in 2 to 3 days, but one has a duration of one year and the other three years, so they will have different progress depicted. The progress changes colors from green to yellow and then to red, depending on how close the expiration date is.
- Expiring in: Is the number of days an asset is expiring.
- Quantity: Is the quantity of the specific asset.
- Total Amount: Is the total amount of money this asset was bought at.
Expiring Trial Subscriptions WIDGET
The Expiring Trial Subscriptions widget displays a list table of the five (5) most close-to-expiring trial subscriptions with an expiring period of five (5) days or less. This widget allows the direct customer to have a quick view of the expiring trial subscriptions along with their respective data. The main purpose of this widget is to prompt the direct customer into taking proactive actions towards those expiring trial subscriptions and upgrade them to paid subscriptions. Moreover, a refresh button is placed on the top right corner of the widget for the Storefront users to be able to update the widget with the latest data.
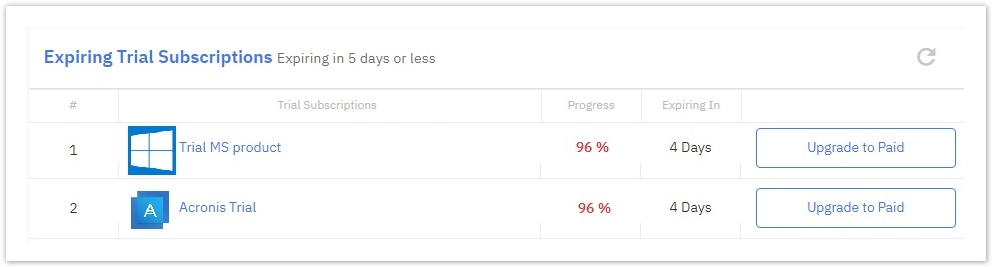
The columns shown in this widget's list are sorted based on the "Progress" column by the closest to being expired and are the following:
- Trial Subscription: Is the default name of the trial subscription; this is a link that redirects the direct customer to the page of the trial subscription with this name(either friendly name or default name).
- Progress: Is the trial subscription's expiration date against the current date, over the total duration of the trial subscription, in the form of a percentage. Meaning that the closer the percentage reaches 100, the less are the remaining days of that trial subscription, before it expires. For example, two trial subscriptions expire in 2 to 3 days, but one has a duration of twenty days and the other ten days, so they will have different progress depicted. The progress changes colors from green to yellow and then to red, depending on how close the expiration date is.
- Expiring in: Is the number of days a trial subscription is expiring.
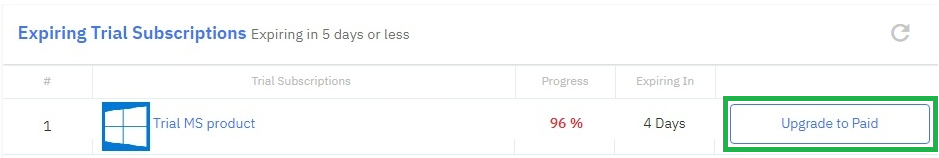
Upgrade to Paid
Next to each active trial subscription visible on the expiring trial subscriptions table there is a button, titled "Upgrade to paid". Its functionality is for the direct customer to upgrade a trial subscription to a paid one. Upon clicking on that button, the direct customer is redirected to an Upgrade <Subscription Name> to Paid page, where he is able to define the unit and the quantity of the subscription, as well as purchase any add-ons and finally checkout with a paid subscription.
Once a trial subscription is upgraded to paid, an order is placed for this product and an invoice is generated with the cost of the product. The start date of the upgraded subscription is considered to be the day that the user converted the subscription to paid.
Expiring Subscriptions WIDGET
The Expiring Subscriptions widget displays a list table of the ten (10) most close-to-expiring annual subscriptions(or bigger billing frequency) with an expiring period of thirty (30) days or less. This widget allows the direct customer to have a quick view of the expiring subscriptions along with their respective data. The main purpose of this widget is to prompt the direct customer into taking proactive actions towards those expiring subscriptions. Moreover, a refresh button is placed on the top right corner of the widget for the Storefront users to be able to update the widget with the latest data.
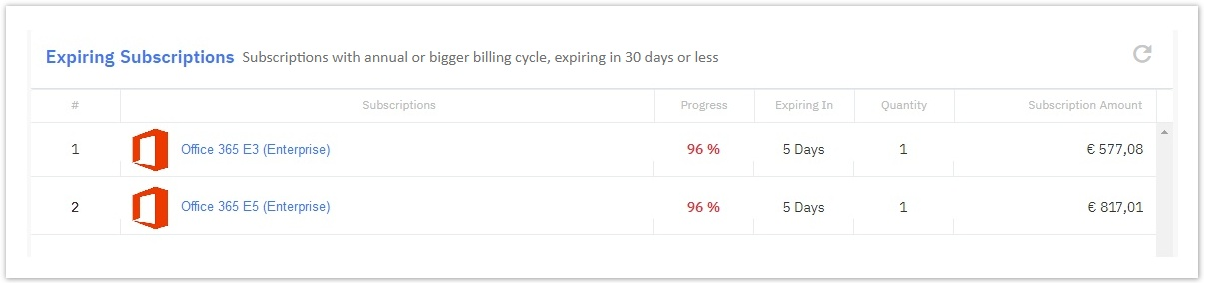
The columns shown in this widget's list are sorted based on the "Progress" column by the closest to being expired and are the following:
- Subscription: Is the subscriptions friendly name if given, otherwise it is the default name of the subscription; this is a link that redirects the direct customer to the page of the subscription with this name.
- Progress: Is the subscription's expiration date against the current date, in the form of a percentage within a circle. Meaning that the closer the percentage reaches 100, the less are the remaining days of that subscription, before it expires. The progress changes colors from green to yellow and then to red, depending on how close the expiration date is.
- Expiring in: Is the number of days a subscription is expiring.
- Quantity: Is the quantity of the specific subscription.
- Subscription Amount: Is the subscription amount displayed on the Subscription's view page in Storefront.
Recently Updated Documents WIDGET
The Recently Updated Documents widget displays a list table of the six (6) latest uploaded and updated documents to the Storefront. This widget allows the direct customer to have a quick view of the uploaded Storefront documents that are linked to this account, along with their respective data. The main purpose of this widget is to provide the direct customer with quick access to the latest Storefront documents. Furthermore, a refresh button is placed on the top right corner of the widget for the Storefront users to be able to update the widget with the latest data. Moreover, in the lower right part of the Widget, there is a button named View All Documents which when clicked, it redirects the direct customer to the My Account page at the Documents List section that contains all the documents linked to this account.
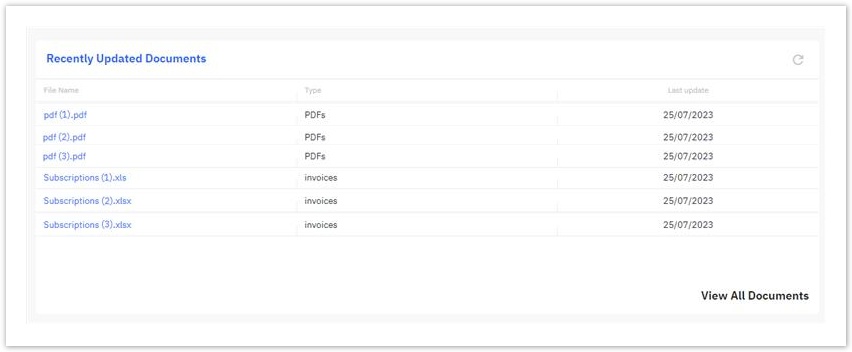
The columns shown in this widget's list are sorted based on the "Last Update" column by the closest to the current date and are the following:
Document Name : Is the custom name defined by the BSS user. The file name is a link that redirects the direct customer to the actual file-download.
Type : Is the type defined by the BSS user, based on the available options defined in the BSS setup (such as PDFs, Invoices, etc.).
Last Update : Is the field that displays the date in which the file was either uploaded or updated. The date format is displayed based on the predefined Storefront settings.
Configuring the Direct Customer's Dashboard and Widgets in BSS
You can configure the direct customer's dashboard very fast in a few easy steps. Learn how by proceeding to the Configuring Direct Customer's Dashboard page.